Ishikawa (Fishbone) Diagram
Ishikawa (or Fishbone) diagrams are one of the 7 basic quality control tools of Total Quality Maintenance (TQM). They are used for brainstorming deeper factors in root cause analyses for production roadblocks and problem solving.
Key Takeaways
Used for root cause, cause/effect analysis, product development
Digs deeper into root causes using 5 Whys, DMAIC method
Has connected lines resembling a fishbone
Fishbone diagrams were first created by Kaoru Ishikawa, a quality control engineer in the Japanese shipbuilding industry during the 1960s.
Since their first introduction in helping assess quality control issues, they have been widely used in other industries outside of shipbuilding, such as information technology, manufacturing, research and development, and product management.
Business methodologies have widely adopted Ishikawa diagrams, finding them to be useful brainstorming exercises in combination with other tools. For example, Ishikawa diagrams are important in Six Sigma, especially alongside the DMAIC approach.
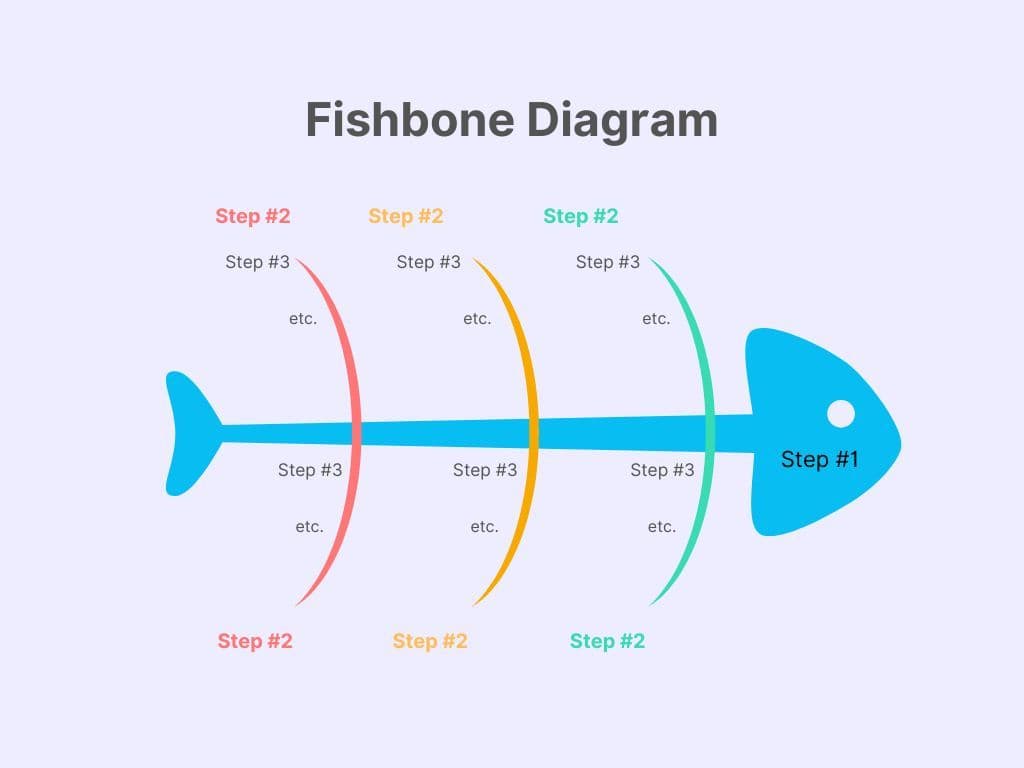
Why Is It Called a Fishbone Diagram?
An Ishikawa diagram is also called a fishbone diagram because the lines represent the bones of a fish skeleton.
The head is where the effect, cause, or problem is written. The head can be a problem (“poor customer service experience”) or an effect (“unplanned machine downtime”). This should be large enough to have many contributing factors, but not too large that there are several competing issues at hand – if there are too many to write along the bones, consider zooming in on a single issue and drawing several related fishbone diagrams.
The “bones” of the fish represent the different categories of contributing factors. Categories can be things like staffing, supply chain, product restrictions, scheduling details, budget requirements, etc.
Along the big bones running off the main spine of the fish are the contributing factors themselves. For example, under the category of “product restrictions” there may be factors listed such as “must weigh under 2 pounds to avoid excess shipping costs”.
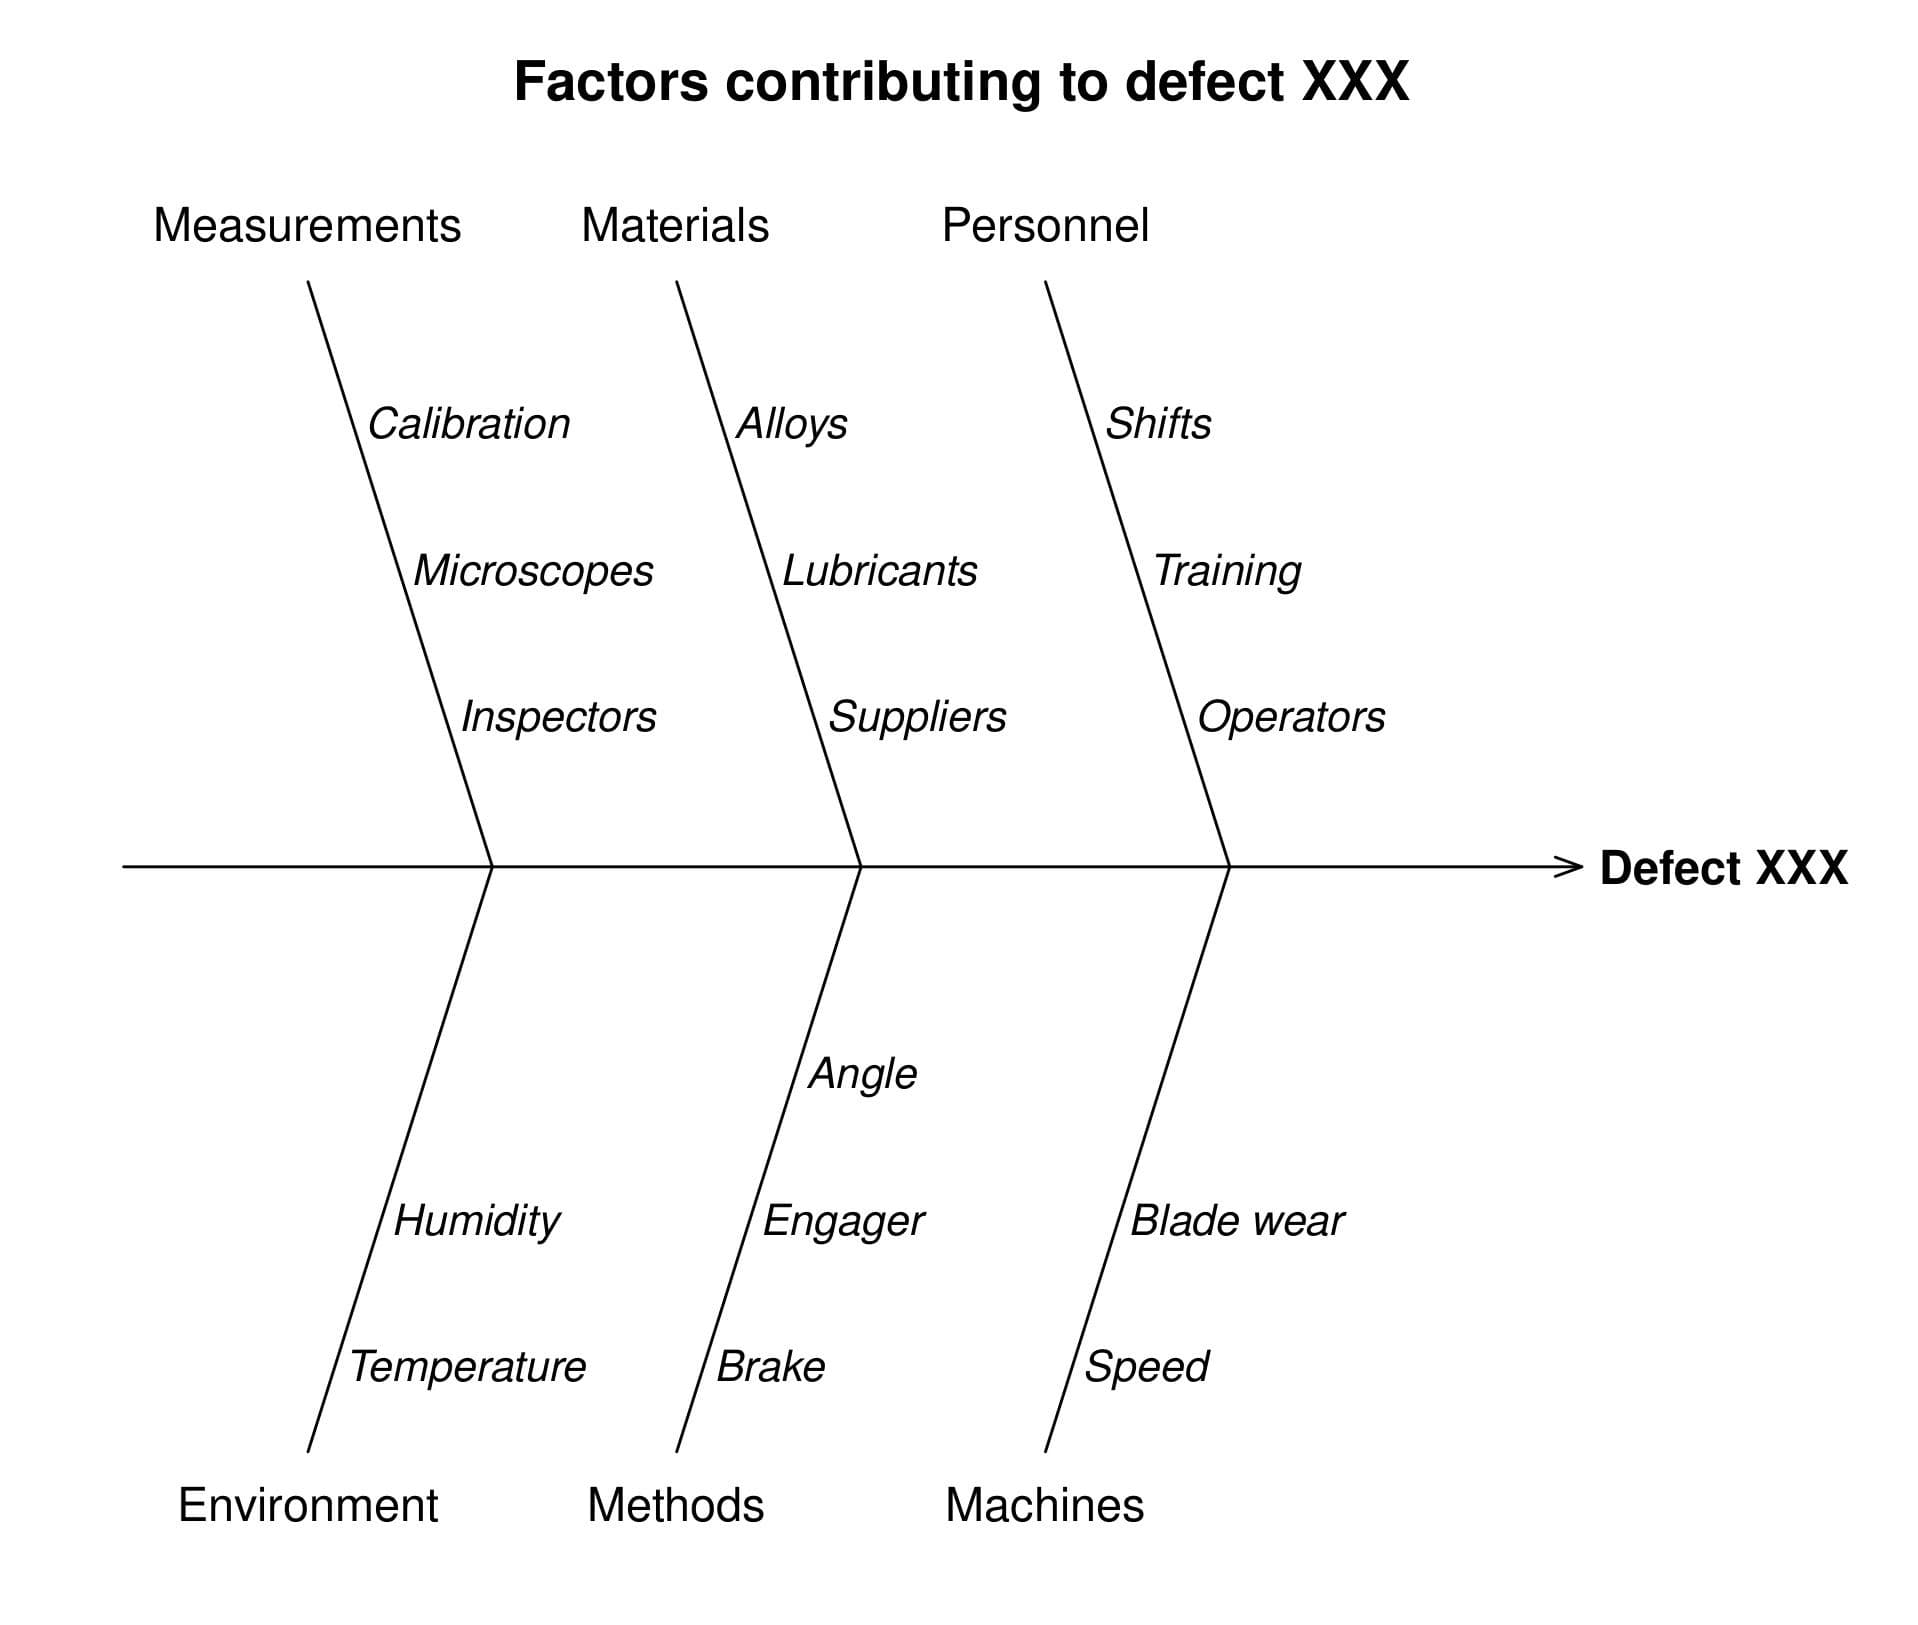
Depending on how many factors contribute to the overall effect, your fishbone could end up looking more like a whale – if that’s the case, consider simplifying your categories, grouping them according to the 5M+E model (Manpower, Machines, Methods, Materials, Measurement, Environment). From there, you can place detailed observations under these categories without expanding your fishbone diagram to frustratingly long dimensions.
And who knows, maybe you have a school of fish (bones) that swim along, creating interconnected root causes in the depths of your manufacturing process. But let’s not get too ahead of ourselves for now.
Let’s go over the benefits and drawbacks of using such diagrams.
Advantages of Ishikawa Diagrams
Ishikawa diagrams, like other management charts and methods of inquiry, are valuable tools for teams looking to solve a variety of problems. The benefits of fishbone diagrams include:
- Practicing using frameworks adjacent to Total Quality Management (TQM)
- Simple enough to be drawn without software or equipment
- Quick approach to brainstorming
- Foster collaborative team building
Overall, the appeal of Ishikawa diagrams is the simplicity. This is what makes them perfect for the beginning stages of problem-solving, including viewing the system at a glance.
At the same time, these diagrams do not provide enough detail to offer potential solutions to the problem. Don’t forget that identifying the problem or pain points is not the same as offering solutions, which should be reserved for the next step in your team’s process.
Draw the fishbone diagram first, then analyze afterwards.
Disadvantages of Ishikawa Diagrams
There are also some disadvantages to using Ishikawa diagrams as problem-solving exercises. Some are:
- Causes can appear in more than one bone branch, confusing actual root of issues
- Charts are too simplistic for problems that have complicated causes
- Results can differ widely depending on the creators’ viewpoints
- Root causes may be workflow disruptions and coordination failures among the entities listed along the fishbone rather than the entities themselves
- Less helpful the deeper the problem-solving plan becomes
To avoid the majority of these disadvantages, understand the point at which Ishikawa diagrams are no longer helpful.
This isn’t necessarily a bad thing! That’s why effective management uses a whole toolbox of methods in order to solve systemic problems.
How to Make An Ishikawa Diagram
Ishikawa diagrams aren’t rocket science – and hopefully by now you know enough about the final product to venture into creating one of your own. But if you’re still lost on where to start, follow these steps to begin your fishbone:
- Identify the problem or effect at hand – remember, this is the “head” of the fishbone. It should be a single, tangible outcome, not an impression or characterization of the entire process
- Identify the categories of contributing factors – to make things easier, give yourself a target of 5 or 6 categories, which should be enough to house the contributing details in the next step
- Brainstorm contributing factors – this is where you should be as specific as possible, seeing as you’ve already set up the categories for these details. All that’s left is to flesh out the bones with these pieces of the puzzle
- Analyze the full extent of the problem as is shown – finally, you can step back and admire your work! What do you see, once you’ve placed everything together?
Hint: If you’re still stuck, try using other handy TQM tools like the 5 Whys or 5M+E. There’s no one right way to fill out an Ishikawa diagram, so play around until things feel right, and then move on to your next framework of analysis.